I worked on this project with Md. Ataul Haque as part of the “Object Oriented Programming in Java” course during my second year of undergraduate curriculum. Main objective of this project is to simulate the 3D graph of an equation. We called the application – Smart Graph.
Primarily Smart Graph generates the solution points for a mathematical function in world coordinate system. Then it changes the 3D world-coordinates into 2D screen-coordinates and then displays the graph. As the graph is generated form the world coordinates, it is possible to view from different angels.
During taking the input function, it takes the minimum and maximum value of X and Y coordinate and the interval of two points. Then the program generates points (x,y,z) using those intervals, starting from the minimum value to the maximum value. Then it generates points for the eye coordinate system from those world-coordinate points and finally points for screen coordinate system from those eye-coordinate points and plots them on the screen.
We have used Java SE for the development.
Here I’ve attached the documentation and the complete source code of the project.
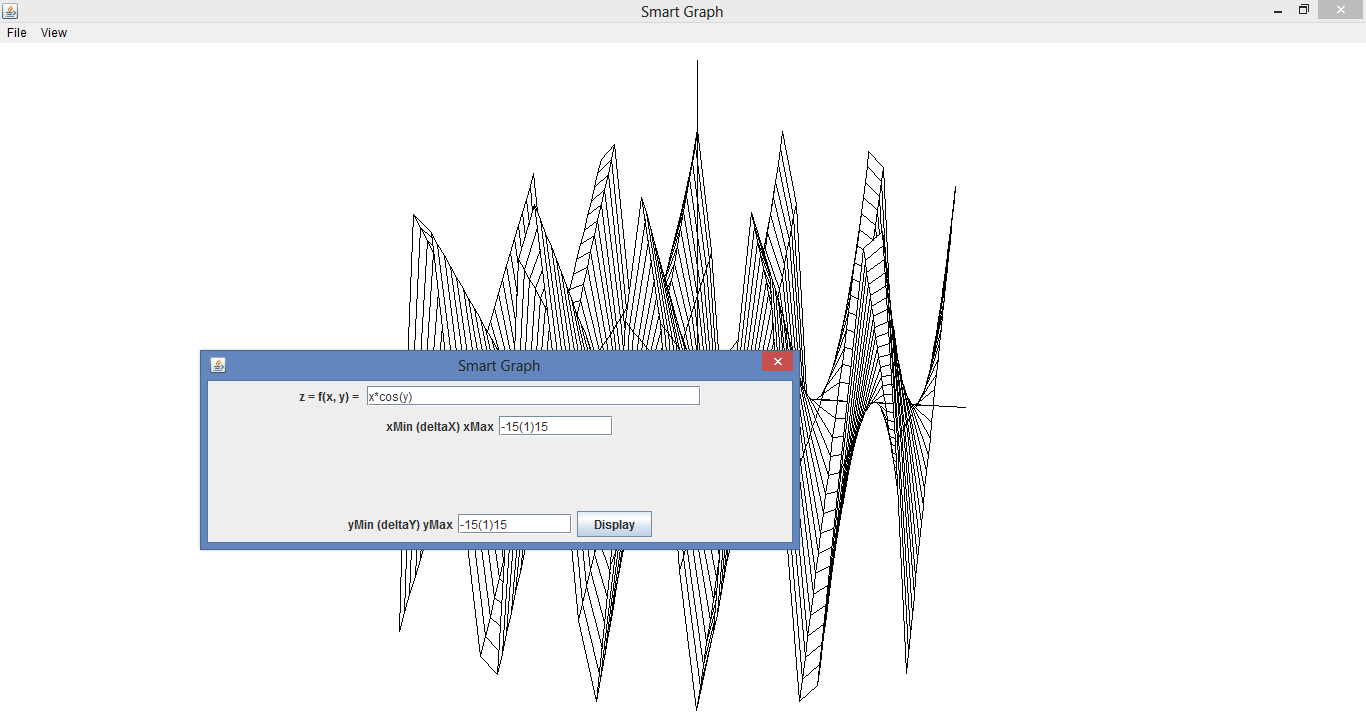
Screen shots
The user interface:

Some outputs generated by the application:
References
- Computer Graphics for Java Programmers
– Leen Ammeraal
- Java™ 2 SDK, Standard Edition Documentation
– Franck Allimant
- Java™ Swing, 2nd Edition
– Brian Cole
– Robert Eckstein
– James Elliott
– Marc Loy
– David Wood
- JDK™ 5.0 Documentation
– Sun Microsystems, Inc.
Downloads
Download the complete documentation here. Also you can download the source code here. The text file inside the archive explains the sequence of compilation.


Leave a Reply